Quantitative Easing, otherwise referred to in the media as ‘QE’, refers to governments printing money out of thin air in order to stimulate economic growth. The US ended their program of QE in late 2014. The impression this left with many people was that the need for economic stimulus ended.
This also goes hand in hand with the media theme that U.S. consumers have been deleveraging by paying down household debt such as mortgages, credit cards, car loans etc. since the 2008 credit crises. The reality is much different than what is being portrayed in the mainstream media.
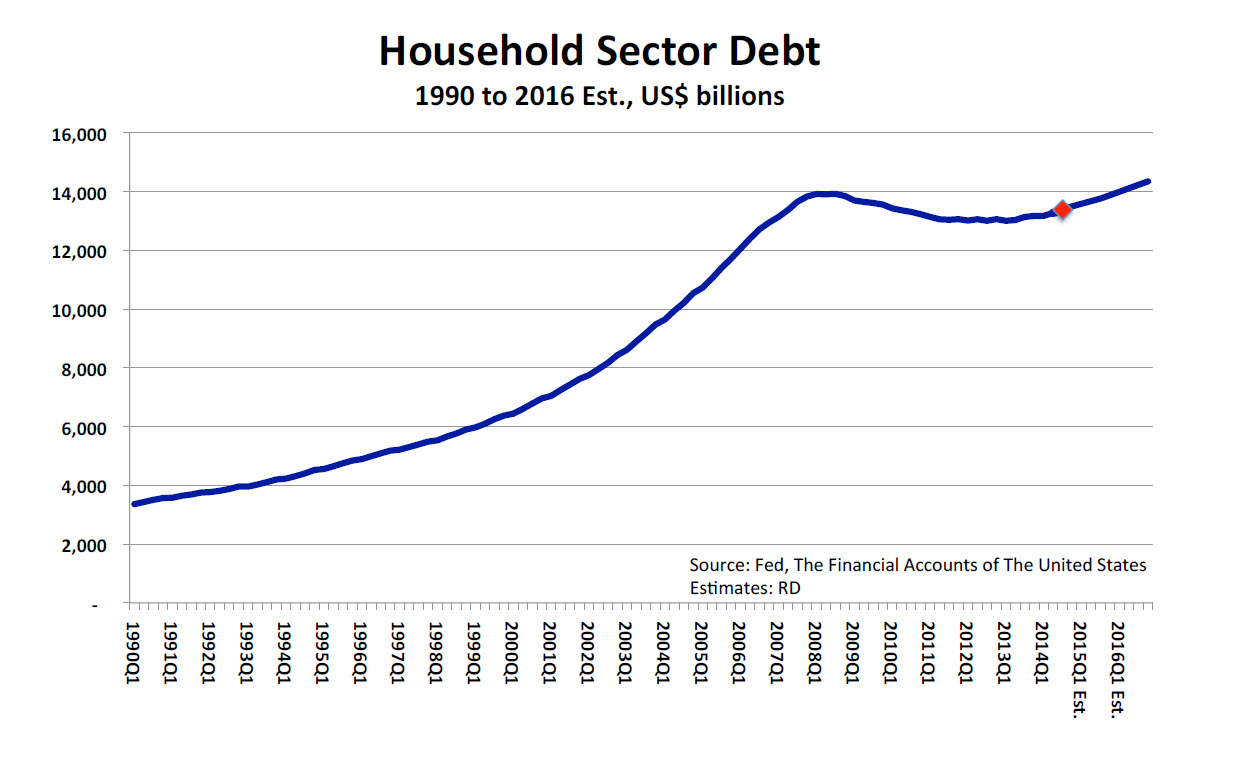
As the graphic shows, U.S consumer debt did drop slightly following 2008 but has more recently risen and is projected to surpass the peak levels of 2008 by sometime in 2016. The red triangle shows where current consumer debt levels are.

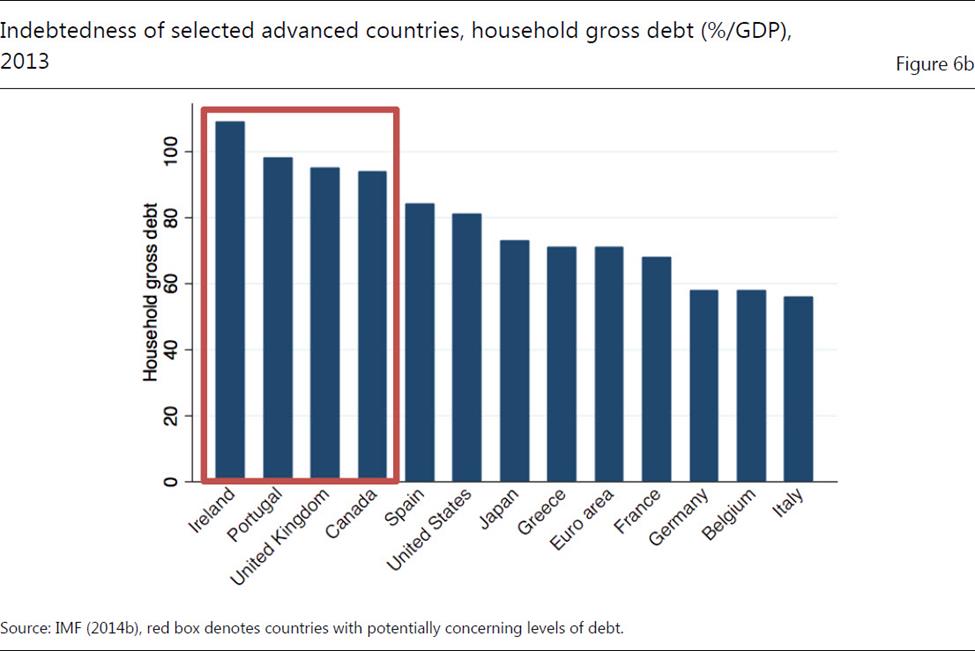
Canada’s consumer debt levels have not only surpassed those of the U.S. but are in fact amongst the highest in the world according to IMF data. Much of this debt is related to Canada’s hot housing market, primarily in cities such as Vancouver, Edmonton, Calgary and Toronto.

So QE has not ended, it has just morphed into other forms and avenues. QE is now a global phenomenon that was spotted in Japan about two years ago and has now migrated to Europe starting sometime in March or April of this year. Europe has been flirting with outright deflation for the most of 2014 and the scramble is on to create economic expansion and inflation. The baton of QE has moved from the US to Europe and other parts of the global economy as growth slows down even in China.
The fear amongst governments is outright deflation leading to a 1930’s style credit bust and depression. That is why countries around the world are scrambling to stimulate economic growth and to gain a competitive advantage through interest rate cuts and reducing the value of their currencies. The Bank of Canada cut interest rates in a surprise move in January and may do so again by the time you read this.
But even in such a climate consumers can still earn reasonable investment returns with the right strategies and diversification. The 1930’s saw some of the best stock market returns on record in the depths of the Great Depression.
Please call us today to review your investment and asset allocation strategy so that you are properly positioned for the changing economic landscape over the next few years.
Chart 1 – Federal Reserve and Richard Duncan Economics with permission. ( www.richardduncaneconomics.com )
Chart 2 – BIS Working Pagers No. 482 January 2015 – ‘Secular Stagnation….’ by Lo and Rogoff. Reprinted with permission.
Questions about debt management?
Contact our office today !
Copyright © 2015 AdvisorNet Communications Inc., under license from W.F.I. All rights reserved. This article is provided for informational purposes only and is not intended to provide specific financial advice. It is strongly recommended that the reader seek qualified professional advice before making any financial decisions based on anything discussed in this article. This article is not to be copied or republished in any format for any reason without the written permission of AdvisorNet Communications. The publisher does not guarantee the accuracy of the information and is not liable in any way for any error or omission.
